Dijkstra, Google
Primary author of this description: A.N.Daryin.
Contents
1 Links
The parallel implementation in C language under discussion. This study was conducted using the Lomonosov supercomputer of the [1] Moscow University Supercomputing Center.
2 Locality of data and computations
2.1 Locality of implementation
2.1.1 Structure of memory access and a qualitative estimation of locality
2.1.2 Quantitative estimation of locality
3 Scalability of the algorithm and its implementations
3.1 Scalability of the algorithm
3.2 Scalability of of the algorithm implementation
Let us study scalability for the parallel implementation of Dijkstra's algorithm in accordance with Scalability methodology.
Variable parameters for the start-up of the algorithm implementation and the limits of parameter variations:
- number of processors [4, 8 : 128] with the squares of integers;
- graph size [16000:64000] with the step 16000.
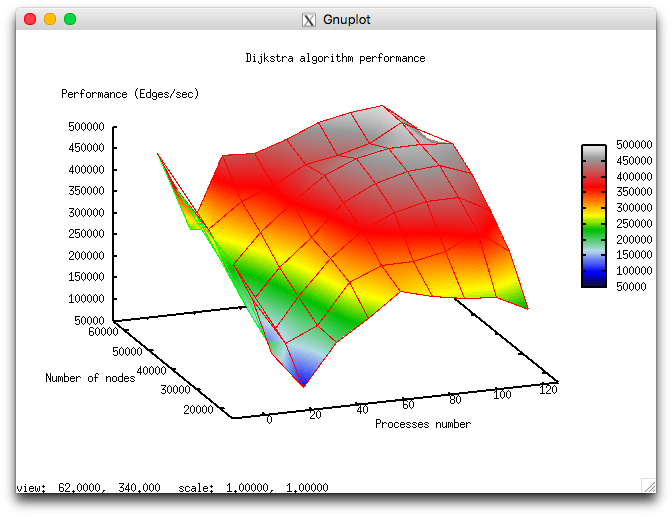
The following figure shows the graph of the performance of the chosen implementation as a function of the variable start-up parameters.
In view of the features of this parallel implementation of Dijkstra's algorithm, the overall performance is rather low. With the growth in the number of processors, the performance improves slowly and even decreases when this number approaches 128. This is explained by the use of collective operations at each iteration of the algorithm and the fact that the communication expenses grow significantly with the increasing number of processors. On each processor, computations are performed fairly fast; consequently, the decomposition of the graph hardly compensates the communication expenses.
4 Dynamic characteristics and efficiency of the algorithm implementation
We used Intel Xeon X5570 processors with the peak performance 94 Gflops and the Intel 13.1.0 compiler. The figures illustrate the efficiency of this implementation for 32 processors.
The graph of CPU loading shows that the loading is about 50 percent almost all the time. This indicates that the processors are loaded uniformly when 8 processes per computational node are executed and Hyper Threading is not used.
Figure 3 shows the graph of the number of floating-point operations per second. It is seen that the overall performance is very low; namely, the peak performance is approximately 250 Kflops, and the performance averaged over all the nodes is about 150 Kflops. This indicates that almost all the calculations in the program are performed on integers.
The graph of L1 cache misses shows that, for several cores, the number of misses is very large. This number is on the level 15 millions per second (the peak values are up to 60 mln/sec), which indicates intensive calculations within some of processes. The number of misses averaged over all the nodes is considerably lower (about 9 mln/sec). This shows that calculations are distributed non-uniformly.
The graph of L3 cache misses shows that this number is very low (about 1,2 mln/sec); however, the value averaged over all the nodes is approximately 0,5 mln/sec. The ratio L1|L3 of cache misses for processes with high performance can be as large as 60, but its average value is about 30. This indicates a very good locality of calculations both of some processes and (on the average) of all the processes, which is an evidence of high performance.
The picture shown in the graph of memory accesses is fairly typical for such applications. The activity of reading is rather low; in combination with low values of L3 cache misses, this indicates good locality. The good locality also indicates that, for this problem, the value about 1 mln/sec is the result of high computational performance, although there is some non-uniformity between the processes.
The graph of memory writes demonstrates a similar picture of non-uniform computations: at one and the same time, only several processes actively perform writes. This correlates with other graphs. One should note a rather low number of memory writes, which indicates a good organization of computations and the sufficiently efficient memory access performance.
The graph of the data rate through Infiniband network shows a fairly high rate measured in bytes per second. This says that the processes communicate intensively and the data portions exchanged are probably rather small because the computational performance is high. It should be noted that the data rate is different for different processes, which indicates an imbalance in computations.
The graph of the data rate measured in packets per second demonstrates an extremely high intensity of data communication. This probably says that the processes very intensively exchange with not very large amounts of data. At each step, collective operations with small portions of data are used, which explains the above observations. The imbalance between the processes is less than those in the graphs of memory use, computations, and data rate in bytes per second. This indicates that the distinct processes exchange with the same number of packets; however, they obtain different amounts of data and perform non-uniform computations.
The graph of the number of processes expecting the beginning of the calculation stage (Loadavg) shows that the value of this parameter in the course of the program execution is a constant, which is approximately equal to 8. This indicates that the program performs stably and all the nodes are loaded with calculations. This also testifies to a very rational and static loading of the hardware resources, as well as a reasonable efficiency of the implementation under study. On the whole, the data of system monitoring make it possible to conclude that the program functioned rather efficiently and stably. The use of memory is very intensive, and the use of communication environment is extremely intensive, whereas the amounts of the transmitted data are not large. For the algorithmic side of the program, this indicates the insistence on the latency of communication environment. To all appearance, the low efficiency is caused by a fairly high amount of transmission from each process and intensive exchanges by messages.
5 Run results
6 References
- ↑ Воеводин Вл., Жуматий С., Соболев С., Антонов А., Брызгалов П., Никитенко Д., Стефанов К., Воеводин Вад. Практика суперкомпьютера «Ломоносов» // Открытые системы, 2012, N 7, С. 36-39.


