LU decomposition via Gaussian elimination, scalability
Revision as of 16:09, 8 July 2022 by ASA (talk | contribs) (Created page with "{{level-i}} Primary author of this description: A.M.Teplov (Section 3). = Links =...")
Primary author of this description: A.M.Teplov (Section 3).
Contents
1 Links
Parallel implementation examined in C.
2 Locality of data and computations
2.1 Locality of implementation
2.1.1 Structure of memory access and a qualitative estimation of locality
2.1.2 Quantitative estimation of locality
3 Scalability of the algorithm and its implementations
3.1 Scalability of the algorithm
3.2 Scalability of of the algorithm implementation
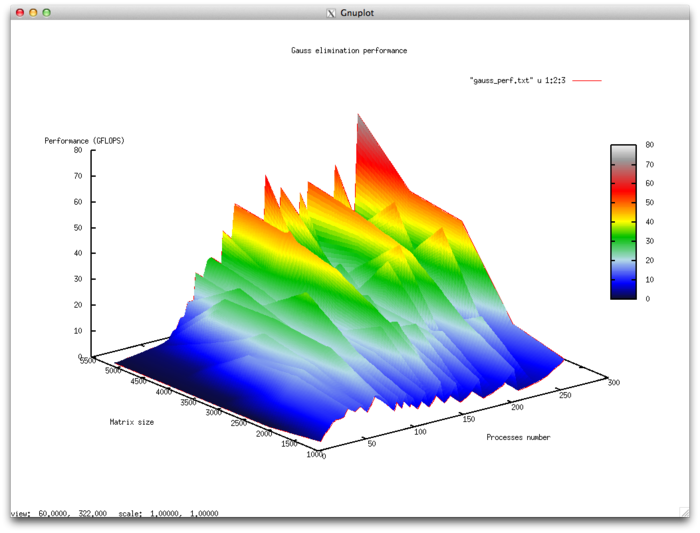
The set of variable launch parameters for the algorithm implementation and limits for the algorithm parameter values:
- Number of processors [4 : 256]
- Matrix size [1024 : 5120]
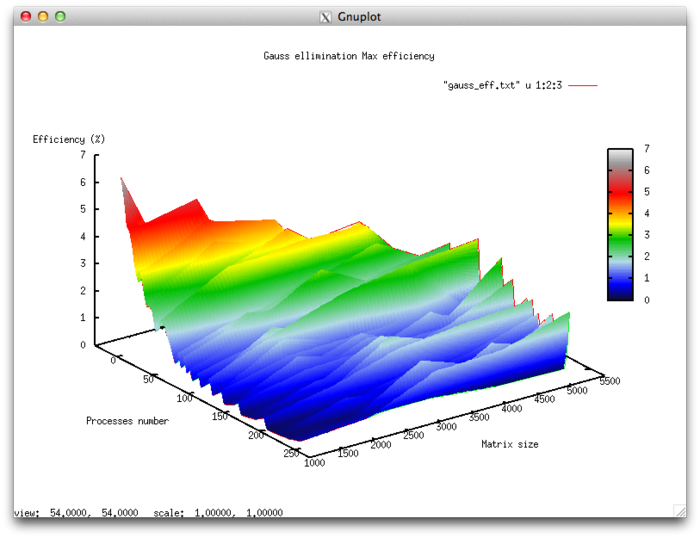
Efficiency of algorithm implementation execution
- Minimum efficiency 0.11%
- Maximum efficiency 6.65%
Scalability evaluation:
- By the number of processes: -0.000101 – as the number of processes increases, overall efficiency declines in the area considered, even though not as intensely as when the task size increases. Considering the 6.5% difference between the maximum and minimum efficiency, we can conclude that the efficiency reduction is most likely quite uniform within the area considered. The efficiency reduction is explained by the fact that as computing power grows, so does the volume of data sent back and forth. Some efficiency increases can be present at all matrix sizes considered. This can be due to increases in the program’s computational complexity, which results in overall efficiency growth given fixed overhead costs for organizing parallel computing.
- By task size: –0.0674 – as the task size grows, efficiency generally decreases within the area considered. This can be explained by the fact that as the task size is increased, so does the overhead cost of organizing parallel computing. As efficiency reduction along this axis is more intense than with an increase in the number of processes, the efficiency drop will most likely be more intense with a smaller number of processes than in existing areas of increasing efficiency with a larger number of processes.
- In both directions: –6.621e-05 – as both computational complexity and the number of processes increase throughout the area considered, efficiency falls, but at a very low rate. Given that the difference between maximum and minimum efficiency at the given range of parameter values is under 6.5%, this shows that if there are any areas on the surface with a very intense change of efficiency, they will have a small area. On the rest of the surface, efficiency changes are small and are located at about the same level.

