Backward substitution, locality
Primary author of this description: Vad.V.Voevodin (Section 2).
Contents
1 Links
The main fragment of the implementation used to obtain the quantitative estimates is given here (the Kernel2 function).
2 Locality of data and computations
2.1 Locality of implementation
2.1.1 Structure of memory access and a qualitative estimation of locality
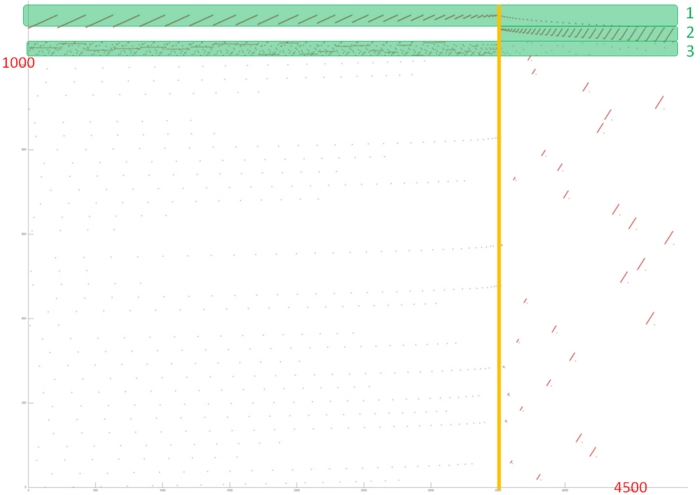
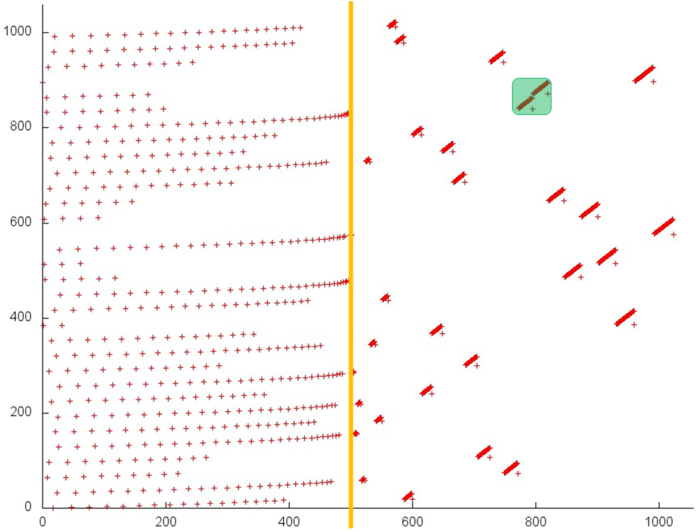
Fig.1 illustrates a general memory-access profile for an implementation chosen to study the backward Gaussian elimination. From this figure it follows that this profile consists of two stages (the boundary between them is highlighted in orange). These stages correspond to the two loops of this implementation taken for our analysis. Based on this analysis, we conclude that the memory-access profile consists of the references to 4 arrays. In Fig. 1, three of them are highlighted in green; the other references are made to the fourth array. Note that the total number of references is greater only by several times than the number of the used elements (4500 and 1000, respectively). Hence, it is difficult to achieve a high degree of locality.
In order to clarify this situation, we consider each of these arrays individually.
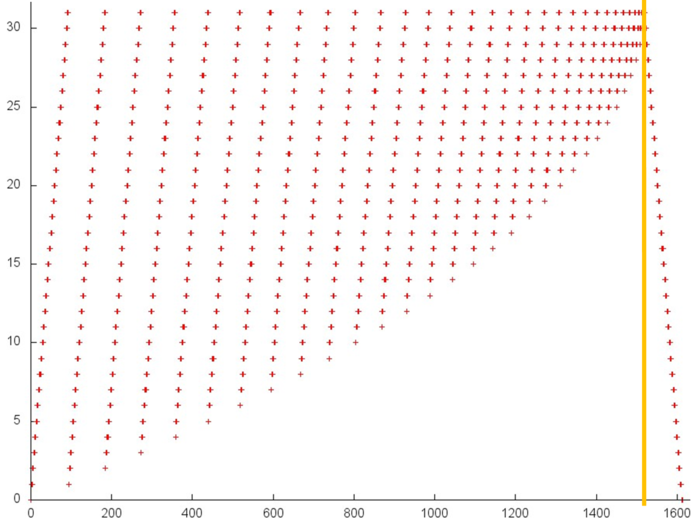
Fig.2 illustrates fragment 1. The orange line delimits the above two stages. The second stage is a linear search in the reverse order. The first stage is iterative: at each iteration, the array’s element with the smallest number is dropped. Such a profile is characterized by a high spatial locality, since the elements are searched in succession, and by a sufficiently high temporal locality, since the repeated references are made to the same elements at each iteration.
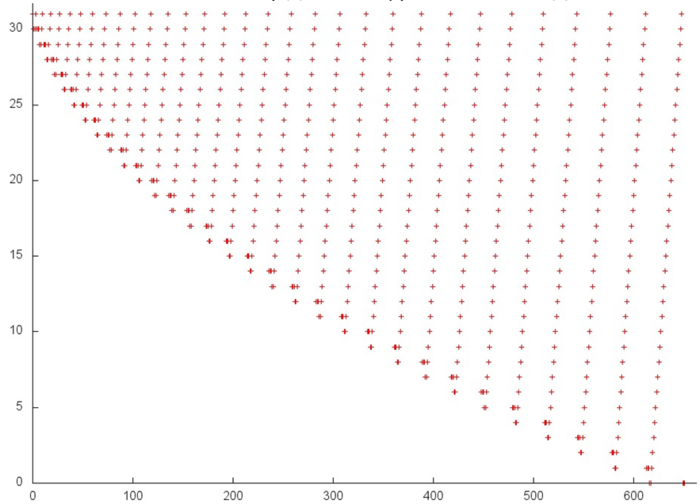
Fig.3 illustrates fragment 2 corresponding to the references to the second array. This fragment is smaller than the previous one: only 600 memory references. In essence, this fragment is similar to fragment 1 (Fig. 2), the only distinction consists in the fact that the iterations are performed in the reverse order. However, this distinction has a little effect on the spatial locality and on the temporal locality. Hence, fragment 2 possesses the same properties.
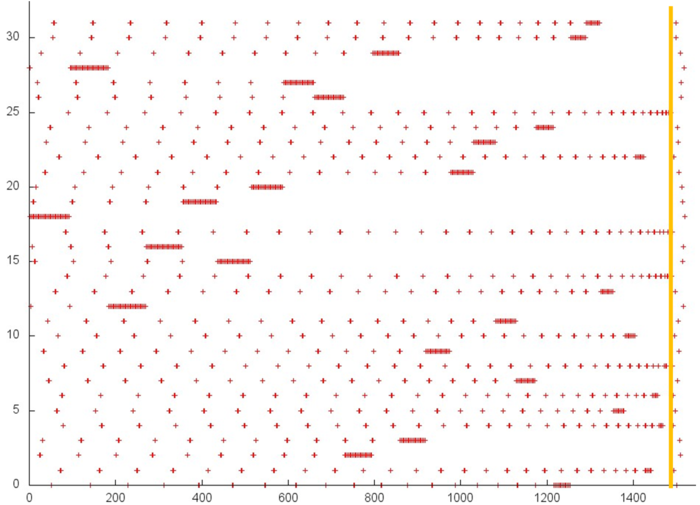
Fig.4 illustrates fragment 3. The orange line also delimits the above two stages. A small number of references are made at the second stage. The references of the first stage are similar to a random access occurring frequently in the case of indirect addressing. Sometimes, many references are made to a certain element in succession, but after that this element is no more used. Usually, such a profile is characterized by a low spatial and temporal locality; however, this disadvantage is not so important, since the number of the element in use is small.
Now we consider the fragment occupying the major part of Fig.1. This profile is presented in Fig.5. The following peculiarity of this profile should be mentioned: more than 1000 elements are used, whereas about 30 elements are used in the other profiles. The number of references is less than the number of references to the first and third arrays.
It should also be noted that the major part of references are made at the second stage. The first stage is similar to the first stage of the previous array (Fig.4); the only exception consists in the fact that in this profile there no multiple references in succession to a single element before this element is no more used. The first stage consists of about 500 references distributed uniformly on a segment of 1000 elements; hence, a very low spatial and temporal locality is observed.
At the second stage, the references are of another character. This stage possesses a higher spatial locality, since the references are grouped in clusters whose structures are similar. However, the structure of the cluster itself requires a deeper analysis.
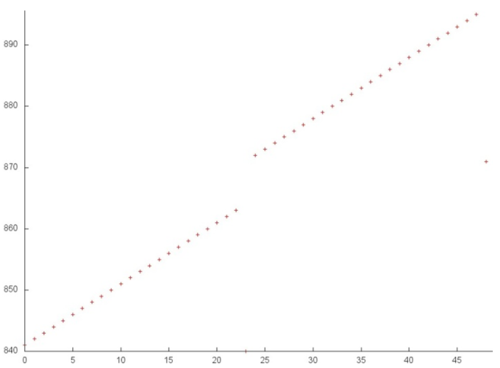
Figure 6 illustrates the two clusters highlighted in green in Fig.5. The scale of Fig.6 allows one to see that each cluster is a linear search with a small step in a subset of the array elements.
Hence, we can conclude that the second stage of fragment 4 possesses a sufficiently high spatial locality, since each cluster contains linear search operations, but the temporal locality is low, since the repeated references are almost absent.
The following conclusion can be made for the entire profile: the first three arrays (especially, the first and second arrays) have a sufficiently high locality. However, a rather low spatial locality and a very low temporal locality of the fourth array significantly reduce the general locality of the entire implementation under study.
2.1.2 Quantitative estimation of locality
The start conditions are discussed here.
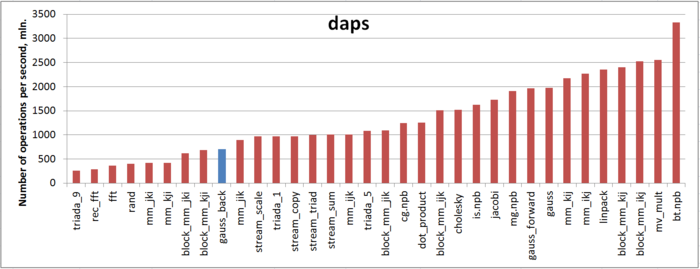
The first estimate is made on the basis of the daps characteristic used to evaluate the number of write and read operations per second. This characteristic is similar to the flops estimate for memory access and is an estimate of the memory usage performance rather than an estimate of locality. However, the daps characteristic is a good information source and can be used to compare with the results obtained according to the cvg characteristic.
Fig.7 illustrates the daps values for a number of some widespread algorithms. These values are given in increasing order: a higher performance corresponds to a larger daps value. From this figure it follows that , according to our above discussion about a negative effect of one of the arrays, this implementation is characterized by a low memory usage performance compared to the forward Gaussian elimination.
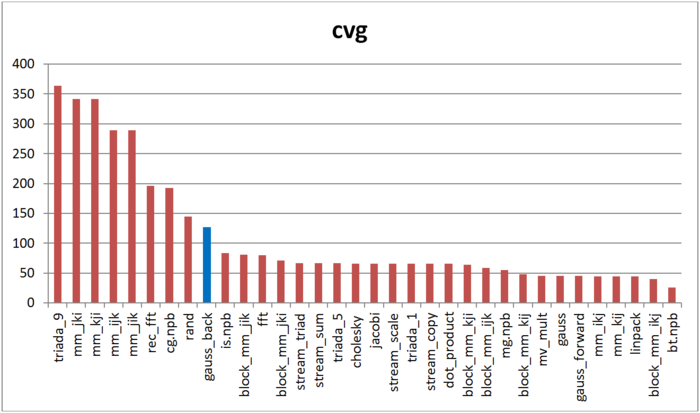
The cvg characteristic is used to obtain a more machine-independent estimate of locality and to specify the frequency of fetching data to the cache memory. A lesser cvg value corresponds to a higher level of locality and to a smaller number of using the fetching procedure.
Fig.8 shows the cvg values for the same implementations presented in Fig. 7. These values are given in decreasing order: a higher locality level corresponds to a smaller cvg value. From this figure it follows that, according to the cvg estimate, the memory access profile possesses a low locality, but a little bit better than in the case of random memory access. This conclusion is similar to that based on our analysis of the daps characteristic.
