Dense matrix multiplication (serial version for real matrices)
Primary authors of this description: A.V.Frolov, Vad.V.Voevodin (Section 2.2), A.M.Teplov (Section 2.4)
Contents
- 1 Properties and structure of the algorithm
- 1.1 General description of the algorithm
- 1.2 Mathematical description of the algorithm
- 1.3 Computational kernel of the algorithm
- 1.4 Macro structure of the algorithm
- 1.5 Implementation scheme of the serial algorithm
- 1.6 Serial complexity of the algorithm
- 1.7 Information graph
- 1.8 Parallelization resource of the algorithm
- 1.9 Input and output data of the algorithm
- 1.10 Properties of the algorithm
- 2 Software implementation of the algorithm
- 2.1 Implementation peculiarities of the serial algorithm
- 2.2 Locality of data and computations
- 2.3 Possible methods and considerations for parallel implementation of the algorithm
- 2.4 Scalability of the algorithm and its implementations
- 2.5 Dynamic characteristics and efficiency of the algorithm implementation
- 2.6 Conclusions for different classes of computer architecture
- 2.7 Existing implementations of the algorithm
- 3 References
1 Properties and structure of the algorithm
1.1 General description of the algorithm
Matrix multiplication is one of the basic procedures in algorithmic linear algebra, which is widely used in a number of different methods. Here, we consider the product [math]C = AB[/math] of dense real matrices (serial real version), that is, the version in which neither a special form of matrices nor the associative properties of the addition operation are used[1].
1.2 Mathematical description of the algorithm
Input data: dense matrix [math]A[/math] of size [math]m[/math]-by-[math]n[/math] (with entries [math]a_{ij}[/math]), dense matrix [math]B[/math] of size [math]n[/math]-by-[math]l[/math] (with entries [math]b_{ij}[/math]).
Output data: dense matrix [math]C[/math] (with entries [math]c_{ij}[/math]).
Formulas of the method:
- [math] \begin{align} c_{ij} = \sum_{k = 1}^{n} a_{ik} b_{kj}, \quad i \in [1, m], \quad i \in [1, l]. \end{align} [/math]
There exists also a block version of the method; however, this description treats only the pointwise version.
1.3 Computational kernel of the algorithm
The computational kernel of the dense matrix multiplication can be compiled of repeated products of [math]A[/math] with the columns of [math]B[/math] (there are on the whole [math]l[/math] such products) or (upon more detailed inspection) of repeated dot products of the rows of [math]A[/math] and the columns of [math]B[/math] (there are on the whole [math]ml[/math] such products):
- [math]\sum_{k = 1}^{n} a_{ik} b_{kj}[/math]
Depending on the problem requirements, these sums are calculated with or without using the accumulation mode.
1.4 Macro structure of the algorithm
As already noted in computational kernel of the algorithm description, the basic part of the dense matrix multiplication is compiled of repeated dot products of the rows of [math]A[/math] and the columns of [math]B[/math] (there are on the whole [math]ml[/math] such products):
- [math]\sum_{k = 1}^{n} a_{ik} b_{kj}[/math]
These calculations are performed with or without using the accumulation mode.
1.5 Implementation scheme of the serial algorithm
For all [math]i[/math] from [math]1[/math] to [math]m[/math] and for all [math]j[/math] from [math]1[/math] to [math]l[/math], do
- [math]c_{ij} = \sum_{k = 1}^{n} a_{ik} b_{kj}[/math]
We emphasize that sums of the form [math]\sum_{k = 1}^{n} a_{ik} b_{kj}[/math] are calculated in the accumulation mode by adding the products [math]a_{ik} b_{kj}[/math] to the current (temporary) value of [math]c_{ij}[/math].The index [math]k[/math] increases from [math]1[/math] to [math]n[/math]. All the sums are initialized to zero. The general scheme is virtually the same if summations are performed in the decreasing order of indices; therefore, this case is not considered. Other orders of summation change the parallel properties of the algorithm and are considered in separate descriptions.
1.6 Serial complexity of the algorithm
The multiplication of two square matrices of order [math]n[/math] (that is, [math]m=n=l[/math]) in the (fastest) serial version requires
- [math]n^3[/math] multiplications and the same number of additions.
The multiplication of an [math]m[/math]-by-[math]n[/math] matrix by an [math]n[/math]-by-[math]l[/math] matrix in the (fastest) serial version requires
- [math]mnl[/math] multiplications and the same number of additions.
The use of accumulation requires that multiplications and additions be done in the double precision mode (or such procedures as the Fortran function DPROD be used). This increases the computation time for performing the matrix multiplication.
In terms of serial complexity, the dense matrix multiplication is qualified as a cubic complexity algorithm (or a trilinear complexity algorithm if the matrices are rectangular).
1.7 Information graph
We describe the algorithm graph both analytically and graphically.
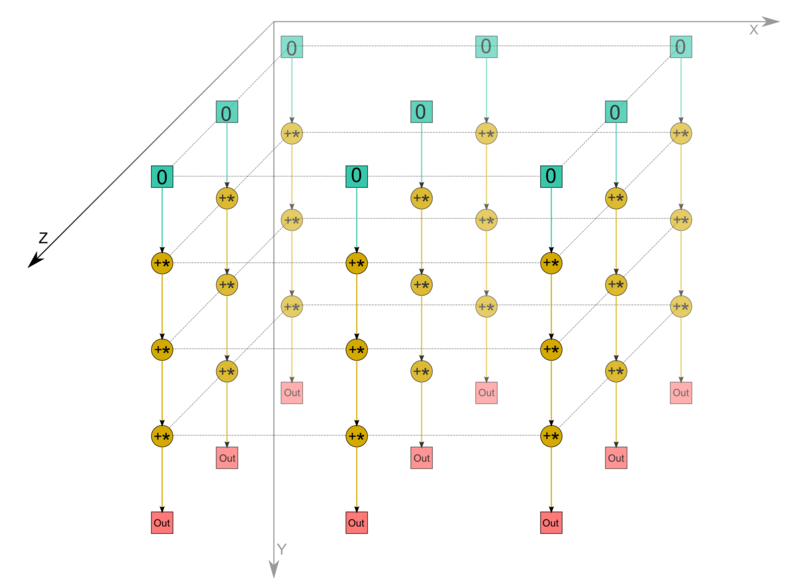
The algorithm graph of multiplying dense matrices consists of a single group of vertices placed at integer nodes of a three-dimensional domain. The corresponding operation is [math]a+bc[/math].
The natural coordinates of this domain are as follows:
- [math]i[/math] varies from [math]1[/math] to [math]m[/math], taking all the integer values in this range;
- [math]j[/math] varies from [math]1[/math] to [math]l[/math], taking all the integer values in this range;
- [math]k[/math] varies from [math]1[/math] to [math]n[/math], taking all the integer values in this range.
The arguments of the operation are as follows:
- [math]a[/math] is:
- the constant [math]0[/math] if [math]k = 1[/math];
- the result of performing the operation corresponding to the vertex with coordinates [math]i, j, k-1[/math] if [math]k \gt 1[/math];
- [math]b[/math] is the element [math]a_{ik}[/math] of the input data;
- [math]c[/math] is the element [math]b_{kj}[/math] of the input data;
The result of performing the operation is:
- an intermediate data item if [math]k \lt n[/math];
- an output data item [math]c_{ij}[/math] if [math]k = n[/math].
1.8 Parallelization resource of the algorithm
The parallel version of the algorithm for multiplying square matrices of order n requires that the following layers be successively performed:
- [math]n[/math] layers of multiplications and the same numbers of layers for addition (there are [math]n^2[/math] operations in each layer).
The multiplication of an [math]m[/math]-by-[math]n[/math] matrix by an [math]n[/math]-by-[math]l[/math] matrix in the (fastest) serial version requires
- [math]n[/math] layers of multiplications and the same numbers of layers for addition (there are [math]ml[/math] operations in each layer).
The use of accumulation requires that multiplications and subtractions be done in the double precision mode. For the parallel version, this implies that virtually all the intermediate calculations in the algorithm must be performed in double precision if the accumulation option is used. Unlike the situation with the serial version, this results in a certain increase in the required memory size.
In terms of the parallel form height, the dense matrix multiplication is qualified as a quadratic complexity algorithm. In terms of the parallel form width, its complexity is also quadratic (for square matrices) or bilinear (for general rectangular matrices).
1.9 Input and output data of the algorithm
Input data: matrix [math]A[/math] (with entries [math]a_{ij}[/math]), matrix [math]B[/math] (with entries [math]b_{ij}[/math])).
Size of the input data : [math]mn+nl[/math]
Output data : matrix [math]C[/math] (with entries [math]c_{ij}[/math]).
Size of the output data: [math]ml[/math]
1.10 Properties of the algorithm
It is clear that, in the case of unlimited resources, the ratio of the serial to parallel complexity is quadratic or bilinear (since this is the ratio of the cubic or trilinear complexity to linear one).
The computational power of the dense matrix multiplication, understood as the ratio of the number of operations to the total size of the input and output data, is linear.
The algorithm of dense matrix multiplication is completely determined. We do not consider any other order of performing associative operations in this version.
2 Software implementation of the algorithm
2.1 Implementation peculiarities of the serial algorithm
In its simplest form, the matrix multiplication algorithm in Fortran can be written as follows:
	DO  I = 1, M
        DO  J = 1, L
		S = 0.
		DO  K = 1, N
			S = S + DPROD(A(I,K), B(K,J))
		END DO
	        C(I, J) = S
        END DO
	END DO
In this case the [math]S[/math] variable must be double precision to implement the accumulation mode.
2.2 Locality of data and computations
2.2.1 Locality of implementation
2.2.1.1 Structure of memory access and a qualitative estimation of locality
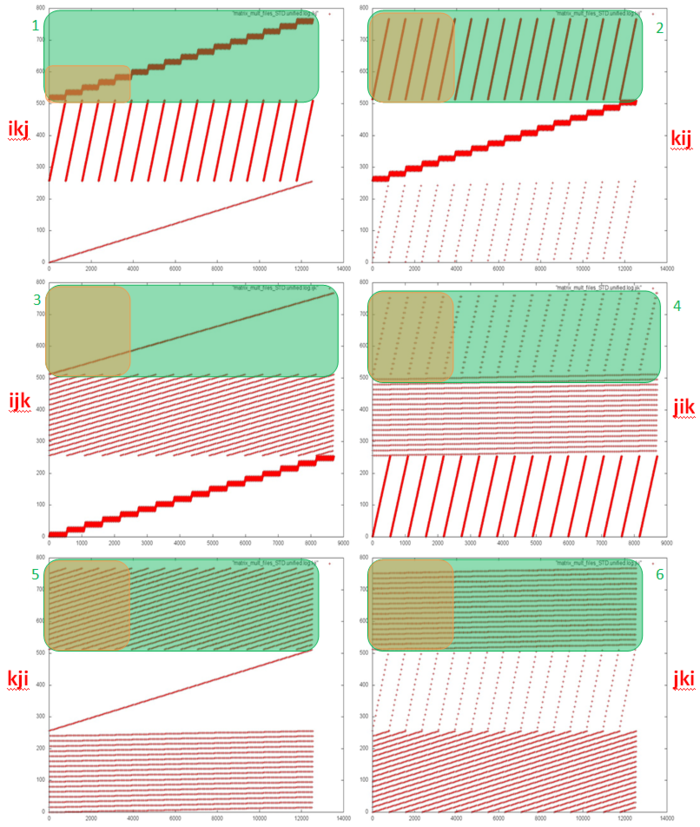
Fig.2 shows six memory call profiles for different variations of classical matrix multiplication (depending on the chosen order of cycles). Each profile has clearly visible segments for the three arrays used in the program. The order in which the three arrays are called is the same in all six variants; i.e., the interaction between the arrays is the same. In this case the differences in locality are determined by the inner construction of profile fragments for each individual array.
Based on the source code, we can see that there are a total of six different fragment types for individual arrays (these types are highlighted in green in Fig.2). Two clarifications need to be made: 1) The profile for the resulting array C is always twice as large because its elements are always addressed two times in a row; 2) if the innermost cycle calls array elements, calls to such elements are moved outside the innermost cycle (the cycle using a scalar variable instead).
It should also be noted also that these profile drawings are made as follows: the overall profile is built first, then only the part related to the respective array is left. The proportion of calls to one array can vary, therefore the frequency of calls in each picture can be substantially different, too.
Let’s look at each of the six fragments in more detail, taking Array C as an example.
“Fragment 1”. Fig.3 shows the beginning of Fragment 1 (hereinafter the beginning of a fragment corresponds to the orange area in Fig.2). The fragment structure is simple: a certain block of array elements is searched, then the search is repeated in a cycle. After that, the program moves to the next block of elements, and the same cyclic search is repeated.
If we look at the fragment in more detail (Fig.4), we can see that each search is in fact sequential, and each element is addressed twice.
As a result, we can conclude that Fragment 1 has a high spatial locality (due to the sequential search and the sequential change of blocks searched), and high temporal locality (due to each element being called twice and all calls to one element being confined to one search block).
“Fragment 2”. Fig.5 shows the beginning of Fragment 2. Clearly, the fragment also features a search of the array elements in a cycle, but in this case each array element is searched within one iteration, not just one block. A closer look at the iteration (Fig.6) reveals that the search is also sequential, and each element is addressed twice (as this is Array C).
This fragment also has a high spatial locality, but the temporal locality is lower than in Fragment 1. This is due to the fact that each iteration of the cycle goes through all of the array elements, not just an individual block, i.e. the interval between consecutive calls to the same element is larger.
“Fragment 3”. The beginning of this fragment is shown in Fig.7. The profile represents a consecutive search through all array elements. But a more detailed analysis shows that each element is addressed twice, with a few calls to other elements in-between. This is explained by the remark above about the recurring call being taken outside of the innermost cycle.
This fragment also has high spatial locality, but low temporal locality, as each element is only addressed twice.
“Fragment 4”. From the beginning of Fragment 4 it is clear that the profile again consists of a search through all array elements, though this time the search is not consecutive but with some interval. One can also notice that the search for each subsequent iteration begins at an element with a somewhat larger index than the previous iteration. In this case there is no need to view the profile in more detail, as this picture provides enough information.
Compared to the previous fragment, this profile has lower spatial locality, as there is a large interval between the elements searched, and very low temporal locality, as each iteration accesses new elements.
“Fragment 5”. Unlike the fragments described earlier, it is hard to draw any conclusions about the memory call structure by looking at the beginning of this fragment (Fig.9). But a more detailed look (Fig.10) shows that this profile is almost identical to the previous fragment. In fact, Fragment 5 actually consists of multiple iterations of Fragment 4.
Compared to Fragment 4, this fragment has almost the same spatial locality, but with higher temporal locality. The reason is the same in both cases – the same set of memory calls is repeated several times.
“Fragment 6”. This fragment, as shown in Fig.12 and Fig.13, also resembles Fragment 5, but with one significant difference. Fragment 5 contains several repetitions of Fragment 4, which in turn contains several iterations, and each iteration within Fragment 4 accesses different elements (with the starting element index being increased by 1 for each iteration). In Fragment 6, the same iterations are performed but in a different order. First, all iterations starting with the same element are performed; then all iterations starting with the next element, etc.
This fragment has higher spatial and temporal locality than Fragment 5, as calls to the same elements are located closer to one another in the profile.
In summary, we can say that Fragments 5 and 6 have the lowest locality in general. Fragment 4 also has lower locality, but contains fewer memory calls and therefore contributes less to the overall memory call profile. This allows us to determine that the least efficient variations from the viewpoint of working with memory are kji and jki, as they contain both Fragment 5 and Fragment 6. The second best are the ijk and jik variations – they each contain one such fragment. And the best variations are ikj and kij.
2.2.1.2 Quantitative estimation of locality
The key implementation fragments which were used to obtain the quantitative assessment are presented here (Kernel*** functions, where *** represents the cycle order (e.g., KernelIJK) ). Launch conditions are described here.
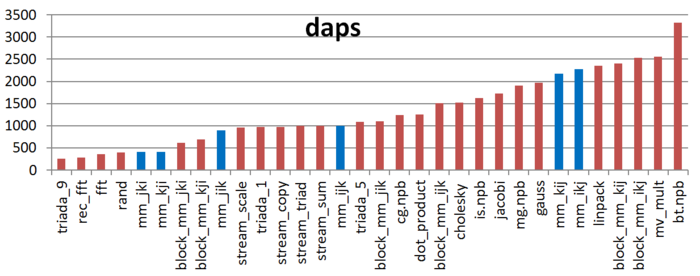
The first estimate is based on daps, which assesses the number of memory access operations (reads and writes) per second. Similar to flops, this tool is used to evaluate memory access performance rather than locality. But it is still a good source of information, particularly in combination with the next estimate – cvg.
Fig.14 shows the daps values for implementations of common algorithms sorted in ascending order (larger daps values generally indicate higher performance). You can see that the kij and ikj versions are predictably the most efficient. The jik and ijk variations show substantially lower results, though nearly equal to each other. As expected, kji and kji exhibit the worst performance.
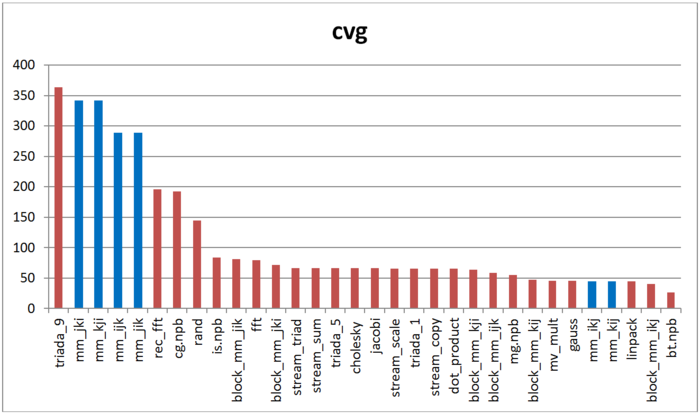
The second tool – cvg – is intended to obtain a more machine-independent locality assessment. It determines how often a program needs to pull data to cache memory. Respectively, the smaller the cvg value, the less frequently data needs to be called to cache, and the better the locality.
Fig.15 shows cvg values for the same set of implementations, sorted in descending order (a lower cvg generally indicates higher locality). You can see that the comparison of cvg results is generally the same as the daps assessment.
2.3 Possible methods and considerations for parallel implementation of the algorithm
2.4 Scalability of the algorithm and its implementations
2.4.1 Scalability of the algorithm
2.4.2 Scalability of of the algorithm implementation
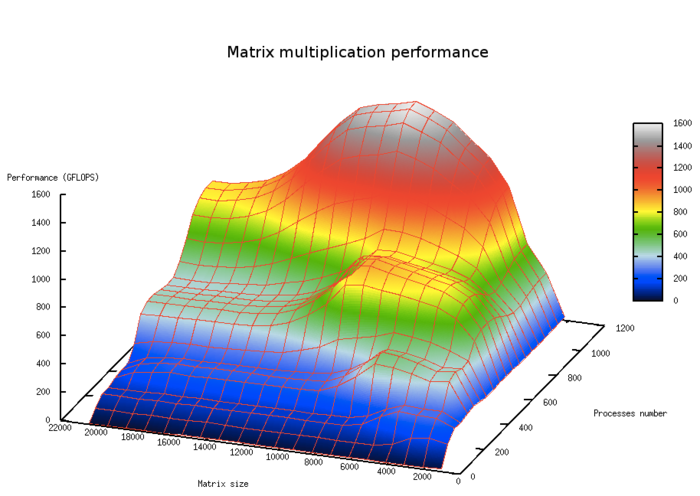
The set of variable launch parameters for implementing the algorithm and limits for algorithm parameter values:
- Number of processors [4 : 1024]
- Matrix size [1024 : 20480]
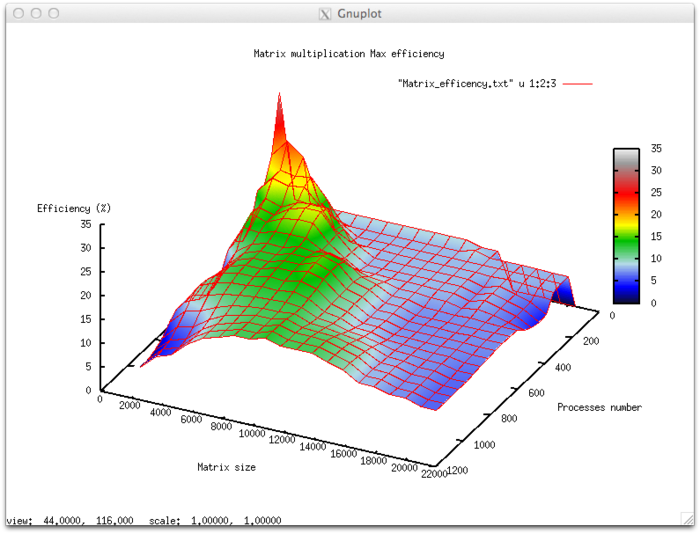
Efficiency of algorithm implementation execution
- Minimum efficiency 4.71%
- Maximum efficiency 31.72%
Scalability evaluation:
- By the number of processes: –0.0436 – as the number of processes increases, efficiency falls rather intensively throughout the launch parameter change area. The efficiency reduction in the parallel program execution area is explained by the higher volumes of data to be sent between the processes and the respective increase in the overhead cost of organizing parallel computation. There is a limited area where efficiency increases with growth in the number of processes; however, further growth decreases the efficiency again. This is explained by data decomposition, which has a moment when matrix size allows the blocks to fit in cache memory. This is also confirmed by the same phenomenon, with a shift in the number of processes, with the growth of computational complexity.
- By the size of the task: –0.0255 – as the task size grows, efficiency generally decreases over the area considered, though not as intensely as with growth in the number of processes. The efficiency reduction is explained by the fact that the volume of data transmitted increases greatly with the growth of computational complexity. At all matrix sizes considered, there is an area with higher efficiency due to the fact that with a smaller task size, the data fits well in cache memory, leading to higher application efficiency at a smaller task size. With further size increases, efficiency drops as the data size expands beyond the cache memory boundaries.
- By two directions: – 0.000968 – when both task complexity and the number of processes are increased, efficiency is reduced, though at a very small rate. Combined with the fact that the difference between maximum and minimum efficiency at the considered parameter area is almost 25%, this shows that the efficiency reduction is uniform over the entire range of tasks, but changes intensively over some small areas. In other areas, efficiency changes are small, staying at approximately the same level.
Algorithm implementation in C.
2.5 Dynamic characteristics and efficiency of the algorithm implementation
2.6 Conclusions for different classes of computer architecture
2.7 Existing implementations of the algorithm
3 References
- ↑ Voevodin V.V., Kuznetsov Yu.A. Matrices and computations, Moscow: Nauka, 1984.
