Dijkstra, locality
Primary author of this description: Vad.V.Voevodin (Section 2).
Contents
1 Links
The basic fragment of the implementation used for obtaining quantitative estimates is given here (function Kernel). The start-up conditions are described here.
2 Locality of data and computations
2.1 Locality of implementation
2.1.1 Structure of memory access and a qualitative estimation of locality
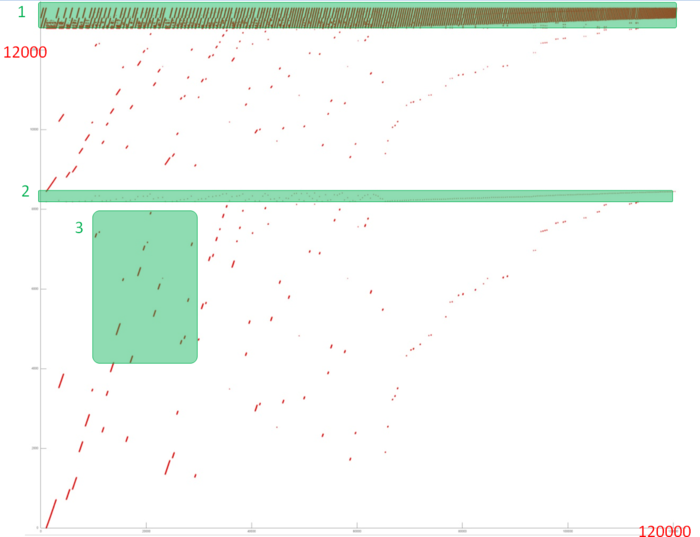
Fig.1 shows the memory address profile for an implementation of Dijkstra's algorithm. The first thing that is evident from this figure is a large separation of accesses. In particular, substantial regions above and below fragment 2 remain empty, while the accesses themselves form only small groups. This indicates low efficiency for two reasons: (a) there are practically no repeated accesses or such accesses occur at significant time intervals; (b) the distance between consecutive accesses may be fairly large.
However, at closer examination, it may turn out that some areas have high locality and consist of a large number of accesses. Moreover, the overall profile contains several areas (fragments 1 and 2) in which the accesses are well localized. It is necessary to inspect individual areas in more detail.
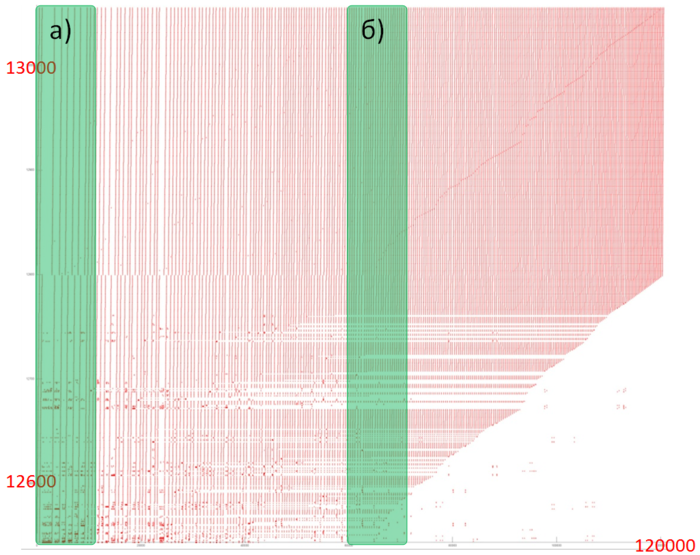
Let us consider fragment 1 (fig.2), within which accesses to two small arrays are performed. One can see that only about 500 elements are involved, and approximately 100 thousands accesses to these elements are done. The overall profile consist of about 120 thousands accesses. It follows that the overwhelming majority of accesses is performed exactly to the above elements.
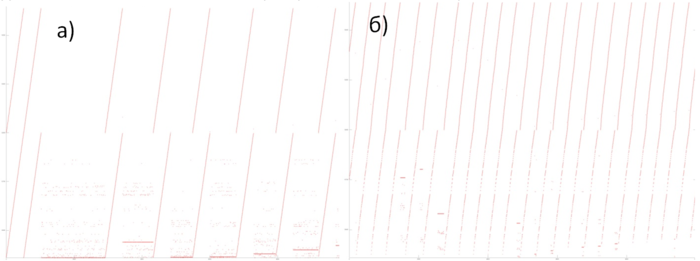
Since, in this case, the number of elements is small, the locality is certainly sufficiently high regardless of the structure of the fragment. Figure 3 shows two subregions of fragment 1. Here, one can see that this fragment mainly consists of successive searches, and the data are often used repeatedly at not very large time intervals. All of this says that both the spatial and temporal localities of the fragment are high.
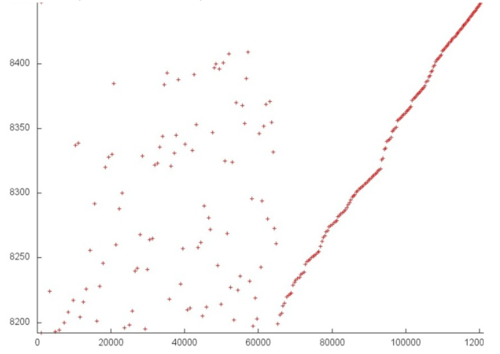
Now, consider in more detail fragment 2 (fig.4). Here, accesses to another service array are performed, and the profile consists of two stages. At the first stage, accesses are scattered fairly chaotically, which reminds the random access. At the second stage, accesses form something like successive search. On the whole, such a profile has a very low temporal locality (because repeated accesses are completely or practically absent) and a rather low spatial locality (due to the random access at the first stage).
Note that the number of elements involved is here greater than in fragment 1; however, the number of accesses is much smaller.
It remains to consider two arrays (the area between fragments 1 and 2 and the area below fragment 2). For these arrays, the patterns of accesses are in many ways similar; consequently, it is sufficient to examine one of them in more detail.
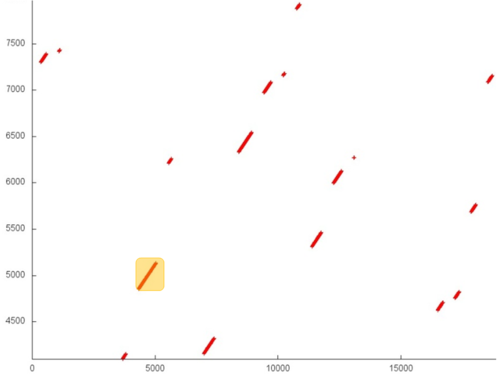
Fragment 3 is shown in fig.5. This fragment represents a fairly large area, which does not allow us to analyze the profile up to individual accesses; however, this is not required here. It is evident that the profile is based on regions with successive searches of a small number of elements or similar searches performed with a small step. For instance, the largest region, distinguished in the fragment in yellow, consists of only two hundred accesses. The distance between different regions may be quite substantial. All of this says that the two arrays under discussion have a very low locality (both spatial and temporal).
On the whole, despite the positive contribution of the arrays in fragment 1, the locality of the overall profile should be rather low because, outside of this fragment, the data are used inefficiently.
2.1.2 Quantitative estimation of locality
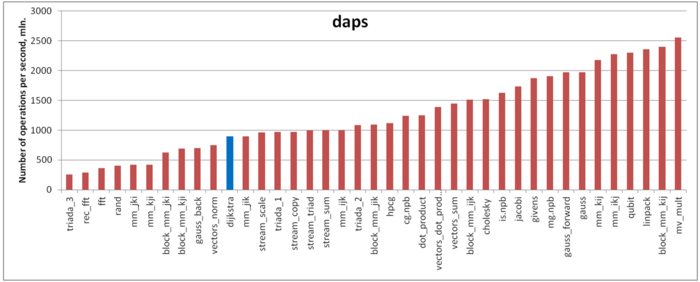
The first estimate is based on daps, which assesses the number of memory accesses (reads and writes) per second. Similar to flops, daps is used to evaluate memory access performance rather than locality. Yet, it is a good source of information, particularly for comparison with the results provided by the next estimate cvg.
Fig.6 shows daps values for implementations of popular algorithms, sorted in ascending order (the higher the daps, the better the performance in general). One can see that the memory access performance is rather low. This is not surprising: implementations of graph algorithms have almost always a low efficiency because the data are accessed irregularly. We observed this while analyzing the memory access profile.
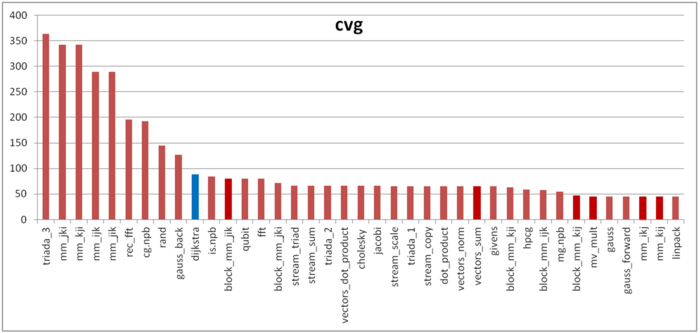
The second characteristic – cvg – is intended for obtaining a more machine-independent locality assessment. It determines how often a program needs to pull data to cache memory. Accordingly, the smaller the cvg value, the less frequently data need to be pulled to cache, and the better the locality.
Fig.7 shows the cvg values for the same set of implementations sorted in descending order (the smaller the cvg, the higher the locality in general). One can see that, in this case, the cvg value is well correlated with the performance estimate. It shows low locality, which conforms to the conclusions made in the qualitative assessment of locality.
