Difference between revisions of "Dijkstra's algorithm"
| [quality revision] | [quality revision] |
(Created page with "Primary authors of this description: A.N.Daryin, Vad.V.Voevodin (#Locality of data and computations|Section...") |
|||
| (52 intermediate revisions by the same user not shown) | |||
| Line 5: | Line 5: | ||
=== General description of the algorithm === | === General description of the algorithm === | ||
| − | ''' | + | '''Dijkstra's algorithm'''<ref>Dijkstra, E W. “A Note on Two Problems in Connexion with Graphs.” Numerische Mathematik 1, no. 1 (December 1959): 269–71. doi:10.1007/BF01386390.</ref> was designed for [[Поиск кратчайшего пути от одной вершины (SSSP)|finding the shortest paths between nodes in a graph]]. For a given weighted digraph with nonnegative weights, the algorithm finds the shortest paths between a singled-out source node and the other nodes of the graph. |
| − | + | ||
| + | Dijkstra's algorithm (using Fibonacci heaps <ref name=FibHeap>Fredman, Michael L, and Robert Endre Tarjan. “Fibonacci Heaps and Their Uses in Improved Network Optimization Algorithms.” Journal of the ACM 34, no. 3 (July 1987): 596–615. doi:10.1145/28869.28874.</ref>) is executed in <math>O(m + n \ln n)</math> time and, asymptotically, is the fastest of the known algorithms for this class of problems. | ||
=== Mathematical description of the algorithm === | === Mathematical description of the algorithm === | ||
| − | + | Let <math>G = (V, E)</math> be a given graph with arc weights <math>f(e)</math> and the single-out source node <math>u</math>. Denote by <math>d(v)</math> the shortest distance between the source <math>u</math> and the node <math>v</math>. | |
| − | + | Suppose that one has already calculated all the distances not exceeding a certain number <math>r</math>, that is, the distances to the nodes in the set <math>V_r = \{ v \in V \mid d(v) \le r \}</math>. Let | |
:<math> | :<math> | ||
(v, w) \in \arg\min \{ d(v) + f(e) \mid v \in V, e = (v, w) \in E \}. | (v, w) \in \arg\min \{ d(v) + f(e) \mid v \in V, e = (v, w) \in E \}. | ||
</math> | </math> | ||
| − | + | Then <math>d(w) = d(v) + f(e)</math> and <math>v</math> lies on the shortest path from <math>u</math> to <math>w</math>. | |
| − | + | The values <math>d^+(w) = d(v) + f(e)</math>, where <math>v \in V_r</math>, <math>e = (v, w) \in E</math>, are called ''expected distances'' and are upper bounds for the actual distances: <math>d(w) \le d^+(w)</math>. | |
| − | + | Dijkstra's algorithm finds at each step the node with the least expected distance, marks this node as a visited one, and updates the expected distances to the ends of all arcs outgoing from this node. | |
=== Computational kernel of the algorithm === | === Computational kernel of the algorithm === | ||
| − | + | The basic computations in the algorithm concern the following operations with priority queues: | |
| − | * | + | * retrieve the minimum element (<code>delete_min</code>); |
| − | * | + | * decrease the priority of an element (<code>decrease_key</code>). |
=== Macro structure of the algorithm === | === Macro structure of the algorithm === | ||
| − | + | Pseudocode of the algorithm: | |
| − | ''' | + | '''Input data''': |
| − | + | graph with nodes ''V'' and arcs ''E'' with weights ''f''(''e''); | |
| − | + | source node ''u''. | |
| − | ''' | + | '''Output data''': distances ''d''(''v'') to each node ''v'' ∈ ''V'' from the node ''u''. |
''Q'' := '''new''' priority queue | ''Q'' := '''new''' priority queue | ||
| Line 51: | Line 52: | ||
=== Implementation scheme of the serial algorithm === | === Implementation scheme of the serial algorithm === | ||
| − | + | A specific implementation of Dijkstra's algorithm is determined by the choice of an algorithm for priority queues. In the simplest case, it can be an array or a list in which search for the minimum requires the inspection of all nodes. Algorithms that use heaps are more efficient. The variant using Fibonacci heaps <ref name=FibHeap /> has the best known complexity estimate. | |
| − | + | It is possible to implement the version in which nodes are added to the queue at the moment of the first visit rather than at the initialization stage. | |
=== Serial complexity of the algorithm === | === Serial complexity of the algorithm === | ||
| − | + | The serial complexity of the algorithm is <math>O(C_1 m + C_2n)</math>, where | |
| − | * <math>C_1</math> | + | * <math>C_1</math> is the number of operations for decreasing the distance to a node; |
| − | * <math>C_2</math> | + | * <math>C_2</math> is the number of operations for calculating minima. |
| − | + | The original Dijkstra's algorithm used lists as an internal data structure. For such lists, <math>C_1 = O(1)</math>, <math>C_2 = O(n)</math>, and the total complexity is <math>O(n^2)</math>. | |
| − | + | If Fibonacci heaps <ref name=FibHeap /> are used, then the time for calculating a minimum decreases to <math>C_2 = O(\ln n)</math> and the total complexity is <math>O(m + n \ln n)</math>, which, asymptotically, is the best known result for this class of problems. | |
=== Information graph === | === Information graph === | ||
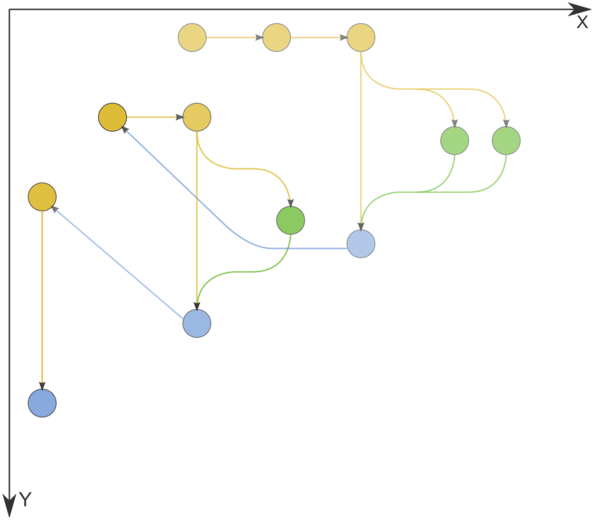
| − | + | Figure 1 shows the graph of the basic implementation of Dijkstra's algorithm based on lists or arrays. | |
| − | [[file:Deikstra.png|thumb|center|600px| | + | [[file:Deikstra.png|thumb|center|600px|Figure 1. Information graph of Dijkstra's algorithm. The input and output data are not shown. n=3. Comparison operations, operations for changing node labels, and node labeling operations are indicated in yellow, green, and blue, respectively.]] |
=== Parallelization resource of the algorithm === | === Parallelization resource of the algorithm === | ||
| − | + | Dijkstra's algorithm admits an efficient parallelization <ref>Crauser, A, K Mehlhorn, U Meyer, and P Sanders. “A Parallelization of Dijkstra's Shortest Path Algorithm,” Proceedings of Mathematical Foundations of Computer Science / Lecture Notes in Computer Science, 1450:722–31, Berlin, Heidelberg: Springer, 1998. doi:10.1007/BFb0055823.</ref> Its average execution time is <math>O(n^{1/3}\ln n)</math>, and the computational complexity is <math>O(n \ln n + m)</math>. | |
| − | [[ | + | The [[algorithm of Δ-stepping]] can be regarded as a parallel version of Dijkstra's algorithm. |
=== Input and output data of the algorithm === | === Input and output data of the algorithm === | ||
| − | ''' | + | '''Input data''': weighted graph <math>(V, E, W)</math> (<math>n</math> nodes <math>v_i</math> and <math>m</math> arcs <math>e_j = (v^{(1)}_{j}, v^{(2)}_{j})</math> with weights <math>f_j</math>), source node <math>u</math>. |
| − | ''' | + | '''Size of input data''': <math>O(m + n)</math>. |
| − | ''' | + | '''Output data''' (possible variants): |
| − | # | + | |
| − | # | + | # for each node <math>v</math> of the original graph, the last arc <math>e^*_v = (w, v)</math> lying on the shortest path from <math>u</math> to <math>v</math> or the corresponding node <math>w</math>; |
| + | # for each node <math>v</math> of the original graph, the summarized weight <math>f^*(v)</math> of the shortest path from <math>u</math> to <math>v</math>. | ||
| − | ''' | + | '''Size of output data''': <math>O(n)</math>. |
=== Properties of the algorithm === | === Properties of the algorithm === | ||
| Line 98: | Line 100: | ||
===== Structure of memory access and a qualitative estimation of locality ===== | ===== Structure of memory access and a qualitative estimation of locality ===== | ||
| − | [[file:dijkstra_1.png|thumb|center|700px| | + | [[file:dijkstra_1.png|thumb|center|700px|Figure 1. Implementation of Dijkstra's algorithm. Overall memory access profile]] |
| − | + | Fig.1 shows the memory address profile for an implementation of Dijkstra's algorithm. The first thing that is evident from this figure is a large separation of accesses. In particular, substantial regions above and below fragment 2 remain empty, while the accesses themselves form only small groups. This indicates low efficiency for two reasons: (a) there are practically no repeated accesses or such accesses occur at significant time intervals; (b) the distance between consecutive accesses may be fairly large. | |
| − | + | However, at closer examination, it may turn out that some areas have high locality and consist of a large number of accesses. Moreover, the overall profile contains several areas (fragments 1 and 2) in which the accesses are well localized. It is necessary to inspect individual areas in more detail. | |
| − | + | Let us consider fragment 1 (fig.2), within which accesses to two small arrays are performed. One can see that only about 500 elements are involved, and approximately 100 thousands accesses to these elements are done. The overall profile consist of about 120 thousands accesses. It follows that the overwhelming majority of accesses is performed exactly to the above elements. | |
| − | [[file:dijkstra_2.png|thumb|center|700px| | + | [[file:dijkstra_2.png|thumb|center|700px|Figure 2. Memory access profile, fragment 1]] |
| − | + | Since, in this case, the number of elements is small, the locality is certainly sufficiently high regardless of the structure of the fragment. Figure 3 shows two subregions of fragment 1. Here, one can see that this fragment mainly consists of successive searches, and the data are often used repeatedly at not very large time intervals. All of this says that both the spatial and temporal localities of the fragment are high. | |
| − | [[file:dijkstra_3.png|thumb|center|700px| | + | [[file:dijkstra_3.png|thumb|center|700px|Figure 3. Profiles of two subregions of fragment 1 (shown in green in fig.2)]] |
| − | + | Now, consider in more detail fragment 2 (fig.4). Here, accesses to another service array are performed, and the profile consists of two stages. At the first stage, accesses are scattered fairly chaotically, which reminds the random access. At the second stage, accesses form something like successive search. On the whole, such a profile has a very low temporal locality (because repeated accesses are completely or practically absent) and a rather low spatial locality (due to the random access at the first stage). | |
| − | + | Note that the number of elements involved is here greater than in fragment 1; however, the number of accesses is much smaller. | |
| − | [[file:dijkstra_4.png|thumb|center|500px| | + | [[file:dijkstra_4.png|thumb|center|500px|Figure 4. Memory access profile, fragment 2]] |
| − | + | It remains to consider two arrays (the area between fragments 1 and 2 and the area below fragment 2). For these arrays, the patterns of accesses are in many ways similar; consequently, it is sufficient to examine one of them in more detail. | |
| − | + | Fragment 3 is shown in fig.5. This fragment represents a fairly large area, which does not allow us to analyze the profile up to individual accesses; however, this is not required here. It is evident that the profile is based on regions with successive searches of a small number of elements or similar searches performed with a small step. For instance, the largest region, distinguished in the fragment in yellow, consists of only two hundred accesses. The distance between different regions may be quite substantial. All of this says that the two arrays under discussion have a very low locality (both spatial and temporal). | |
| − | [[file:dijkstra_5.png|thumb|center|500px| | + | [[file:dijkstra_5.png|thumb|center|500px|Figure 5. Memory access profile, fragment 3]] |
| − | + | On the whole, despite the positive contribution of the arrays in fragment 1, the locality of the overall profile should be rather low because, outside of this fragment, the data are used inefficiently. | |
===== Quantitative estimation of locality ===== | ===== Quantitative estimation of locality ===== | ||
| − | + | The basic fragment of the implementation used for obtaining quantitative estimates is given [http://git.parallel.ru/shvets.pavel.srcc/locality/blob/master/benchmarks/dijkstra/dijkstra.h here] (function Kernel). The start-up conditions are described [http://git.parallel.ru/shvets.pavel.srcc/locality/blob/master/README.md here]. | |
| + | |||
| + | The first estimate is based on daps, which assesses the number of memory accesses (reads and writes) per second. Similar to flops, daps is used to evaluate memory access performance rather than locality. Yet, it is a good source of information, particularly for comparison with the results provided by the next estimate cvg. | ||
| − | + | Fig.6 shows daps values for implementations of popular algorithms, sorted in ascending order (the higher the daps, the better the performance in general). One can see that the memory access performance is rather low. This is not surprising: implementations of graph algorithms have almost always a low efficiency because the data are accessed irregularly. We observed this while analyzing the memory access profile. | |
| − | + | [[file:dijkstra_daps.png|thumb|center|700px|Figure 6. Comparison of daps values]] | |
| − | + | The second characteristic – cvg – is intended for obtaining a more machine-independent locality assessment. It determines how often a program needs to pull data to cache memory. Accordingly, the smaller the cvg value, the less frequently data need to be pulled to cache, and the better the locality. | |
| − | + | Fig.7 shows the cvg values for the same set of implementations sorted in descending order (the smaller the cvg, the higher the locality in general). One can see that, in this case, the cvg value is well correlated with the performance estimate. It shows low locality, which conforms to the conclusions made in the qualitative assessment of locality. | |
| − | |||
| − | [[file:dijkstra_cvg.png|thumb|center|700px| | + | [[file:dijkstra_cvg.png|thumb|center|700px|Figure 7. Comparison of cvg values]] |
=== Possible methods and considerations for parallel implementation of the algorithm === | === Possible methods and considerations for parallel implementation of the algorithm === | ||
| Line 146: | Line 149: | ||
=== Scalability of the algorithm and its implementations === | === Scalability of the algorithm and its implementations === | ||
==== Scalability of the algorithm ==== | ==== Scalability of the algorithm ==== | ||
| − | ==== Scalability | + | ==== Scalability of the algorithm implementation ==== |
| − | + | Let us study scalability for the parallel implementation of Dijkstra's algorithm in accordance with [[Scalability methodology|Scalability methodology]]. This study was conducted using the Lomonosov supercomputer of the <ref name="Lom">Воеводин Вл., Жуматий С., Соболев С., Антонов А., Брызгалов П., Никитенко Д., Стефанов К., Воеводин Вад. Практика суперкомпьютера «Ломоносов» // Открытые системы, 2012, N 7, С. 36-39.</ref> [http://parallel.ru/cluster Moscow University Supercomputing Center]. | |
| − | + | Variable parameters for the start-up of the algorithm implementation and the limits of parameter variations: | |
| − | * | + | * number of processors [4, 8 : 128] with the squares of integers; |
| − | * | + | * graph size [16000:64000] with the step 16000. |
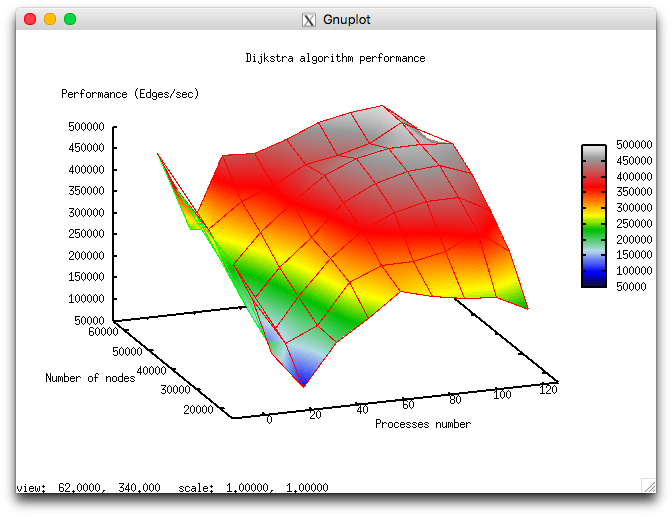
| − | + | The following figure shows the graph of the [[Глоссарий#Производительность|performance]] of the chosen implementation as a function of the variable start-up parameters. | |
| − | [[file:Dijkstra perf.png|thumb|center|700px| | + | [[file:Dijkstra perf.png|thumb|center|700px|Figure 8. Parallel implementation of Dijkstra's algorithm. Performance as a function of the number of processors and the area size.]] |
| − | + | In view of the features of this parallel implementation of Dijkstra's algorithm, the overall performance is rather low. With the growth in the number of processors, the performance improves slowly and even decreases when this number approaches 128. This is explained by the use of collective operations at each iteration of the algorithm and the fact that the communication expenses grow significantly with the increasing number of processors. On each processor, computations are performed fairly fast; consequently, the decomposition of the graph hardly compensates the communication expenses. | |
| − | + | ||
| − | [https://code.google.com/p/prir-dijkstra-mpi/source/browse/trunk/project/dijkstra_mpi.c | + | [https://code.google.com/p/prir-dijkstra-mpi/source/browse/trunk/project/dijkstra_mpi.c The parallel implementation in C language under discussion] |
=== Dynamic characteristics and efficiency of the algorithm implementation === | === Dynamic characteristics and efficiency of the algorithm implementation === | ||
| − | + | The experiments were conducted for the above implementation of Dijkstra's algorithm. All the results were obtained with the «Lomonosov» supercomputer. We used Intel Xeon X5570 processors with the peak performance 94 Gflops and the Intel 13.1.0 compiler. The figures illustrate the efficiency of this implementation for 32 processors. | |
| − | |||
| − | [[file:Dijkstra CPU User.png|thumb|center|700px| | + | [[file:Dijkstra CPU User.png|thumb|center|700px|Figure 9. Graph of CPU loading while executing Dijkstra's algorithm]] |
| − | + | The graph of CPU loading shows that the loading is about 50 percent almost all the time. This indicates that the processors are loaded uniformly when 8 processes per computational node are executed and Hyper Threading is not used. | |
| − | [[file:Dijkstra Flops.png|thumb|center|700px| | + | [[file:Dijkstra Flops.png|thumb|center|700px|Figure 10. Graph of the number of floating-point operations per second while executing Dijkstra's algorithm]] |
| − | + | Figure 10 shows the graph of the number of floating-point operations per second. It is seen that the overall performance is very low; namely, the peak performance is approximately 250 Kflops, and the performance averaged over all the nodes is about 150 Kflops. This indicates that almost all the calculations in the program are performed on integers. | |
| − | [[file:Dijkstra L1.png|thumb|center|700px| | + | |
| + | [[file:Dijkstra L1.png|thumb|center|700px|Figure 11. Graph of L1 cache misses per second while executing Dijkstra's algorithm]] | ||
| − | + | The graph of L1 cache misses shows that, for several cores, the number of misses is very large. This number is on the level 15 millions per second (the peak values are up to 60 mln/sec), which indicates intensive calculations within some of processes. The number of misses averaged over all the nodes is considerably lower (about 9 mln/sec). This shows that calculations are distributed non-uniformly. | |
| − | [[file:Dijkstra L3.png|thumb|center|700px| | + | |
| + | [[file:Dijkstra L3.png|thumb|center|700px|Figure 12. Graph of L3 cache misses per second while executing Dijkstra's algorithm]] | ||
| + | |||
| + | The graph of L3 cache misses shows that this number is very low (about 1,2 mln/sec); however, the value averaged over all the nodes is approximately 0,5 mln/sec. The ratio L1|L3 of cache misses for processes with high performance can be as large as 60, but its average value is about 30. This indicates a very good locality of calculations both of some processes and (on the average) of all the processes, which is an evidence of high performance. | ||
| + | |||
| + | [[file:Dijkstra Mem Load.png|thumb|center|700px|Figure 13. Graph of the number of RAM reads while executing Dijkstra's algorithm]] | ||
| + | |||
| + | The picture shown in the graph of memory accesses is fairly typical for such applications. The activity of reading is rather low; in combination with low values of L3 cache misses, this indicates good locality. The good locality also indicates that, for this problem, the value about 1 mln/sec is the result of high computational performance, although there is some non-uniformity between the processes. | ||
| + | |||
| + | [[file:Dijkstra Mem Store.png|thumb|center|700px|Figure 14. Graph of the number of RAM writes while executing Dijkstra's algorithm]] | ||
| + | |||
| + | The graph of memory writes demonstrates a similar picture of non-uniform computations: at one and the same time, only several processes actively perform writes. This correlates with other graphs. One should note a rather low number of memory writes, which indicates a good organization of computations and the sufficiently efficient memory access performance. | ||
| + | |||
| + | [[file:Dijkstra Inf DATA.png|thumb|center|700px|Figure 15. Graph of the data rate through Infiniband network (in bytes per second) while executing Dijkstra's algorithm]] | ||
| − | + | The graph of the data rate through Infiniband network shows a fairly high rate measured in bytes per second. This says that the processes communicate intensively and the data portions exchanged are probably rather small because the computational performance is high. It should be noted that the data rate is different for different processes, which indicates an imbalance in computations. | |
| − | |||
| − | + | [[file:Dijkstra Inf PCKTS.png|thumb|center|700px|Figure 16. Graph of the data rate through Infiniband network (in packets per second) while executing Dijkstra's algorithm]] | |
| − | [[file:Dijkstra | ||
| − | + | The graph of the data rate measured in packets per second demonstrates an extremely high intensity of data communication. This probably says that the processes very intensively exchange with not very large amounts of data. At each step, collective operations with small portions of data are used, which explains the above observations. The imbalance between the processes is less than those in the graphs of memory use, computations, and data rate in bytes per second. This indicates that the distinct processes exchange with the same number of packets; however, they obtain different amounts of data and perform non-uniform computations. | |
| − | |||
| − | + | [[file:Dijkstra Load ABG.png|thumb|center|700px|Figure 17. Graph of the number of processes expecting the beginning of the calculation stage (Loadavg) while executing Dijkstra's algorithm]] | |
| − | [[file:Dijkstra | ||
| − | + | The graph of the number of processes expecting the beginning of the calculation stage (Loadavg) shows that the value of this parameter in the course of the program execution is a constant, which is approximately equal to 8. This indicates that the program performs stably and all the nodes are loaded with calculations. This also testifies to a very rational and static loading of the hardware resources, as well as a reasonable efficiency of the implementation under study. On the whole, the data of system monitoring make it possible to conclude that the program functioned rather efficiently and stably. The use of memory is very intensive, and the use of communication environment is extremely intensive, whereas the amounts of the transmitted data are not large. For the algorithmic side of the program, this indicates the insistence on the latency of communication environment. To all appearance, the low efficiency is caused by a fairly high amount of transmission from each process and intensive exchanges by messages. | |
| − | |||
| − | |||
| − | |||
| − | |||
=== Conclusions for different classes of computer architecture === | === Conclusions for different classes of computer architecture === | ||
=== Existing implementations of the algorithm === | === Existing implementations of the algorithm === | ||
| − | * C++: [http://www.boost.org/libs/graph/doc/ Boost Graph Library] ( | + | * C++: [http://www.boost.org/libs/graph/doc/ Boost Graph Library] (functions <code>[http://www.boost.org/libs/graph/doc/dijkstra_shortest_paths.html dijkstra_shortest_paths]</code>, <code>[http://www.boost.org/libs/graph/doc/dijkstra_shortest_paths_no_color_map.html dijkstra_shortest_paths_no_color_map]</code>), complexity <math>O(m + n \ln n)</math>. |
* C++, MPI: [http://www.boost.org/libs/graph_parallel/doc/html/index.html Parallel Boost Graph Library]: | * C++, MPI: [http://www.boost.org/libs/graph_parallel/doc/html/index.html Parallel Boost Graph Library]: | ||
| − | ** | + | ** function <code>[http://www.boost.org/libs/graph_parallel/doc/html/dijkstra_shortest_paths.html#eager-dijkstra-s-algorithm eager_dijkstra_shortest_paths]</code> – direct implementation of Dijkstra's algorithm; |
| − | ** | + | ** function <code>[http://www.boost.org/libs/graph_parallel/doc/html/dijkstra_shortest_paths.html#crauser-et-al-s-algorithm crauser_et_al_shortest_paths]</code> – implementation of Dijkstra's algorithm as proposed in the paper <ref>Crauser, A, K Mehlhorn, U Meyer, and P Sanders. “A Parallelization of Dijkstra's Shortest Path Algorithm,” Proceedings of Mathematical Foundations of Computer Science / Lecture Notes in Computer Science, 1450:722–31, Berlin, Heidelberg: Springer, 1998. doi:10.1007/BFb0055823.</ref> |
| − | * Python: [https://networkx.github.io NetworkX] ( | + | * Python: [https://networkx.github.io NetworkX] (function <code>[http://networkx.github.io/documentation/networkx-1.9.1/reference/generated/networkx.algorithms.shortest_paths.weighted.single_source_dijkstra.html single_source_dijkstra]</code>). |
| − | * Python/C++: [https://networkit.iti.kit.edu NetworKit] ( | + | * Python/C++: [https://networkit.iti.kit.edu NetworKit] (class <code>[https://networkit.iti.kit.edu/data/uploads/docs/NetworKit-Doc/python/html/graph.html#networkit.graph.Dijkstra networkit.graph.Dijkstra]</code>). |
== References == | == References == | ||
Revision as of 11:57, 24 November 2017
Primary authors of this description: A.N.Daryin, Vad.V.Voevodin (Section 2.2).
Contents
- 1 Properties and structure of the algorithm
- 1.1 General description of the algorithm
- 1.2 Mathematical description of the algorithm
- 1.3 Computational kernel of the algorithm
- 1.4 Macro structure of the algorithm
- 1.5 Implementation scheme of the serial algorithm
- 1.6 Serial complexity of the algorithm
- 1.7 Information graph
- 1.8 Parallelization resource of the algorithm
- 1.9 Input and output data of the algorithm
- 1.10 Properties of the algorithm
- 2 Software implementation of the algorithm
- 2.1 Implementation peculiarities of the serial algorithm
- 2.2 Locality of data and computations
- 2.3 Possible methods and considerations for parallel implementation of the algorithm
- 2.4 Scalability of the algorithm and its implementations
- 2.5 Dynamic characteristics and efficiency of the algorithm implementation
- 2.6 Conclusions for different classes of computer architecture
- 2.7 Existing implementations of the algorithm
- 3 References
1 Properties and structure of the algorithm
1.1 General description of the algorithm
Dijkstra's algorithm[1] was designed for finding the shortest paths between nodes in a graph. For a given weighted digraph with nonnegative weights, the algorithm finds the shortest paths between a singled-out source node and the other nodes of the graph.
Dijkstra's algorithm (using Fibonacci heaps [2]) is executed in [math]O(m + n \ln n)[/math] time and, asymptotically, is the fastest of the known algorithms for this class of problems.
1.2 Mathematical description of the algorithm
Let [math]G = (V, E)[/math] be a given graph with arc weights [math]f(e)[/math] and the single-out source node [math]u[/math]. Denote by [math]d(v)[/math] the shortest distance between the source [math]u[/math] and the node [math]v[/math].
Suppose that one has already calculated all the distances not exceeding a certain number [math]r[/math], that is, the distances to the nodes in the set [math]V_r = \{ v \in V \mid d(v) \le r \}[/math]. Let
- [math] (v, w) \in \arg\min \{ d(v) + f(e) \mid v \in V, e = (v, w) \in E \}. [/math]
Then [math]d(w) = d(v) + f(e)[/math] and [math]v[/math] lies on the shortest path from [math]u[/math] to [math]w[/math].
The values [math]d^+(w) = d(v) + f(e)[/math], where [math]v \in V_r[/math], [math]e = (v, w) \in E[/math], are called expected distances and are upper bounds for the actual distances: [math]d(w) \le d^+(w)[/math].
Dijkstra's algorithm finds at each step the node with the least expected distance, marks this node as a visited one, and updates the expected distances to the ends of all arcs outgoing from this node.
1.3 Computational kernel of the algorithm
The basic computations in the algorithm concern the following operations with priority queues:
- retrieve the minimum element (
delete_min); - decrease the priority of an element (
decrease_key).
1.4 Macro structure of the algorithm
Pseudocode of the algorithm:
Input data:
  graph with nodes V and arcs E with weights f(e);
  source node u.
Output data: distances d(v) to each node v ∈ V from the node u.

Q := new priority queue
for each v ∈ V:
    if v = u then d(v) := 0 else d(v) := ∞
    Q.insert(v, d(v))

while Q ≠ ∅:
    v := Q.delete_min()
    for each e = (v, w) ∈ E:
        if d(w) > d(v) + f(e):
            d(w) := d(v) + f(e)
            Q.decrease_key(w, d(w))
1.5 Implementation scheme of the serial algorithm
A specific implementation of Dijkstra's algorithm is determined by the choice of an algorithm for priority queues. In the simplest case, it can be an array or a list in which search for the minimum requires the inspection of all nodes. Algorithms that use heaps are more efficient. The variant using Fibonacci heaps [2] has the best known complexity estimate.
It is possible to implement the version in which nodes are added to the queue at the moment of the first visit rather than at the initialization stage.
1.6 Serial complexity of the algorithm
The serial complexity of the algorithm is [math]O(C_1 m + C_2n)[/math], where
- [math]C_1[/math] is the number of operations for decreasing the distance to a node;
- [math]C_2[/math] is the number of operations for calculating minima.
The original Dijkstra's algorithm used lists as an internal data structure. For such lists, [math]C_1 = O(1)[/math], [math]C_2 = O(n)[/math], and the total complexity is [math]O(n^2)[/math].
If Fibonacci heaps [2] are used, then the time for calculating a minimum decreases to [math]C_2 = O(\ln n)[/math] and the total complexity is [math]O(m + n \ln n)[/math], which, asymptotically, is the best known result for this class of problems.
1.7 Information graph
Figure 1 shows the graph of the basic implementation of Dijkstra's algorithm based on lists or arrays.
1.8 Parallelization resource of the algorithm
Dijkstra's algorithm admits an efficient parallelization [3] Its average execution time is [math]O(n^{1/3}\ln n)[/math], and the computational complexity is [math]O(n \ln n + m)[/math].
The algorithm of Δ-stepping can be regarded as a parallel version of Dijkstra's algorithm.
1.9 Input and output data of the algorithm
Input data: weighted graph [math](V, E, W)[/math] ([math]n[/math] nodes [math]v_i[/math] and [math]m[/math] arcs [math]e_j = (v^{(1)}_{j}, v^{(2)}_{j})[/math] with weights [math]f_j[/math]), source node [math]u[/math].
Size of input data: [math]O(m + n)[/math].
Output data (possible variants):
- for each node [math]v[/math] of the original graph, the last arc [math]e^*_v = (w, v)[/math] lying on the shortest path from [math]u[/math] to [math]v[/math] or the corresponding node [math]w[/math];
- for each node [math]v[/math] of the original graph, the summarized weight [math]f^*(v)[/math] of the shortest path from [math]u[/math] to [math]v[/math].
Size of output data: [math]O(n)[/math].
1.10 Properties of the algorithm
2 Software implementation of the algorithm
2.1 Implementation peculiarities of the serial algorithm
2.2 Locality of data and computations
2.2.1 Locality of implementation
2.2.1.1 Structure of memory access and a qualitative estimation of locality
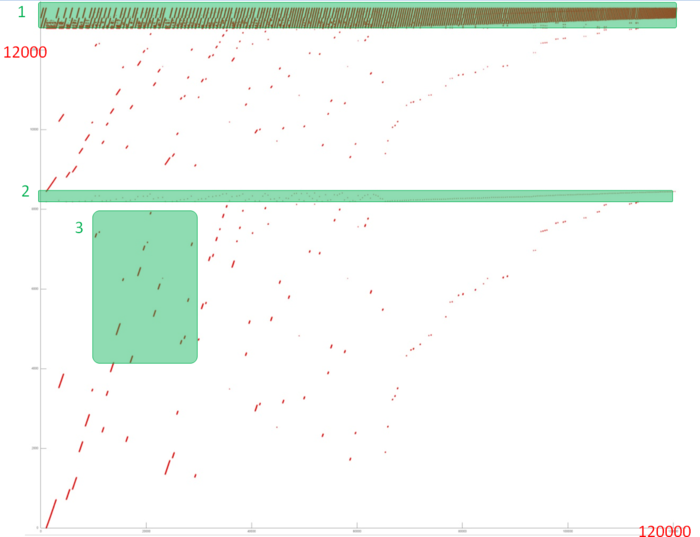
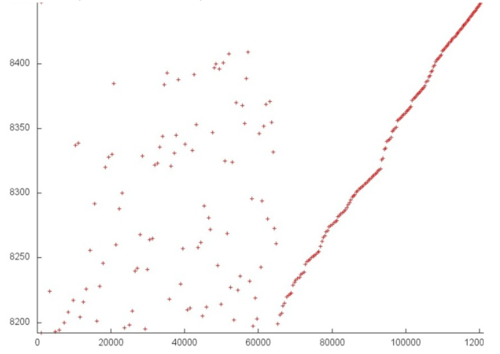
Fig.1 shows the memory address profile for an implementation of Dijkstra's algorithm. The first thing that is evident from this figure is a large separation of accesses. In particular, substantial regions above and below fragment 2 remain empty, while the accesses themselves form only small groups. This indicates low efficiency for two reasons: (a) there are practically no repeated accesses or such accesses occur at significant time intervals; (b) the distance between consecutive accesses may be fairly large.
However, at closer examination, it may turn out that some areas have high locality and consist of a large number of accesses. Moreover, the overall profile contains several areas (fragments 1 and 2) in which the accesses are well localized. It is necessary to inspect individual areas in more detail.
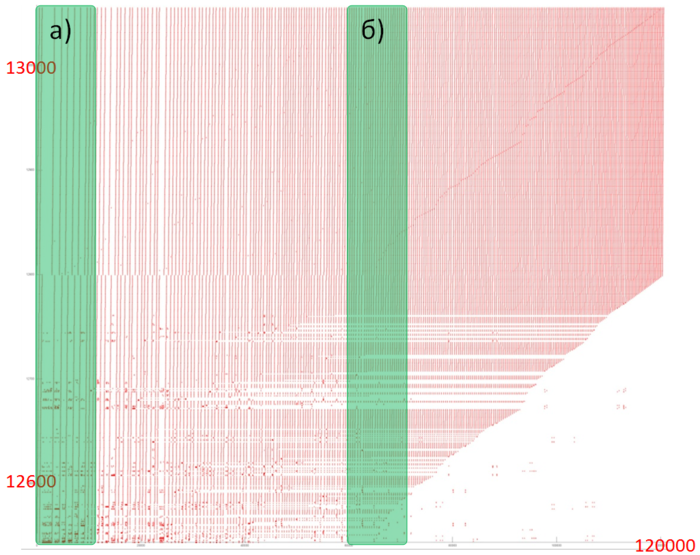
Let us consider fragment 1 (fig.2), within which accesses to two small arrays are performed. One can see that only about 500 elements are involved, and approximately 100 thousands accesses to these elements are done. The overall profile consist of about 120 thousands accesses. It follows that the overwhelming majority of accesses is performed exactly to the above elements.
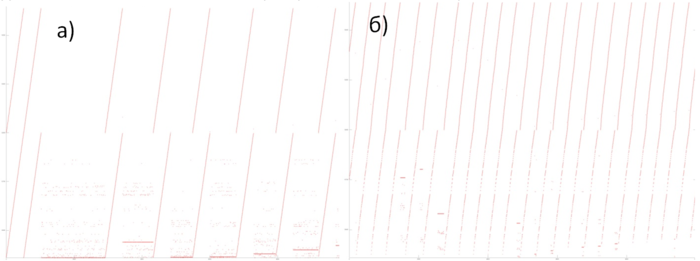
Since, in this case, the number of elements is small, the locality is certainly sufficiently high regardless of the structure of the fragment. Figure 3 shows two subregions of fragment 1. Here, one can see that this fragment mainly consists of successive searches, and the data are often used repeatedly at not very large time intervals. All of this says that both the spatial and temporal localities of the fragment are high.
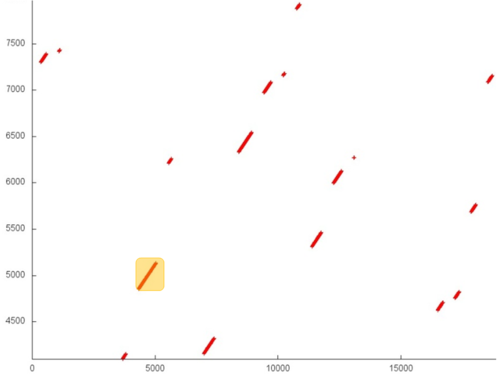
Now, consider in more detail fragment 2 (fig.4). Here, accesses to another service array are performed, and the profile consists of two stages. At the first stage, accesses are scattered fairly chaotically, which reminds the random access. At the second stage, accesses form something like successive search. On the whole, such a profile has a very low temporal locality (because repeated accesses are completely or practically absent) and a rather low spatial locality (due to the random access at the first stage).
Note that the number of elements involved is here greater than in fragment 1; however, the number of accesses is much smaller.
It remains to consider two arrays (the area between fragments 1 and 2 and the area below fragment 2). For these arrays, the patterns of accesses are in many ways similar; consequently, it is sufficient to examine one of them in more detail.
Fragment 3 is shown in fig.5. This fragment represents a fairly large area, which does not allow us to analyze the profile up to individual accesses; however, this is not required here. It is evident that the profile is based on regions with successive searches of a small number of elements or similar searches performed with a small step. For instance, the largest region, distinguished in the fragment in yellow, consists of only two hundred accesses. The distance between different regions may be quite substantial. All of this says that the two arrays under discussion have a very low locality (both spatial and temporal).
On the whole, despite the positive contribution of the arrays in fragment 1, the locality of the overall profile should be rather low because, outside of this fragment, the data are used inefficiently.
2.2.1.2 Quantitative estimation of locality
The basic fragment of the implementation used for obtaining quantitative estimates is given here (function Kernel). The start-up conditions are described here.
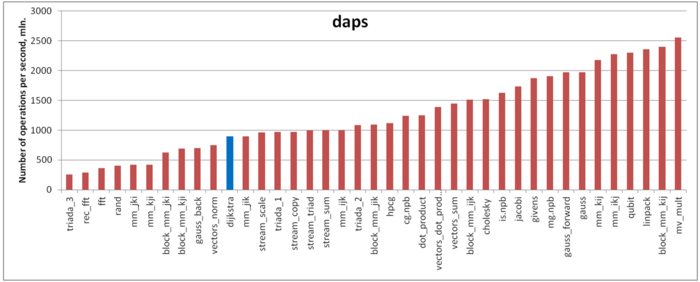
The first estimate is based on daps, which assesses the number of memory accesses (reads and writes) per second. Similar to flops, daps is used to evaluate memory access performance rather than locality. Yet, it is a good source of information, particularly for comparison with the results provided by the next estimate cvg.
Fig.6 shows daps values for implementations of popular algorithms, sorted in ascending order (the higher the daps, the better the performance in general). One can see that the memory access performance is rather low. This is not surprising: implementations of graph algorithms have almost always a low efficiency because the data are accessed irregularly. We observed this while analyzing the memory access profile.
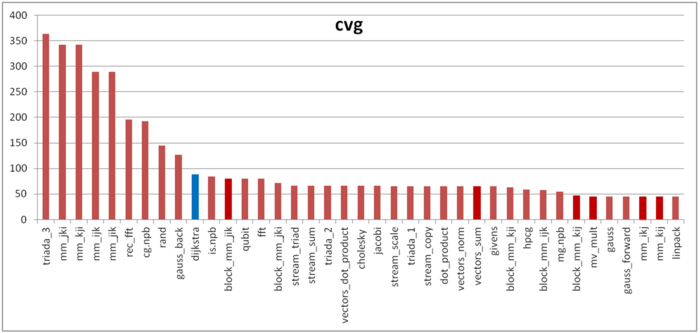
The second characteristic – cvg – is intended for obtaining a more machine-independent locality assessment. It determines how often a program needs to pull data to cache memory. Accordingly, the smaller the cvg value, the less frequently data need to be pulled to cache, and the better the locality.
Fig.7 shows the cvg values for the same set of implementations sorted in descending order (the smaller the cvg, the higher the locality in general). One can see that, in this case, the cvg value is well correlated with the performance estimate. It shows low locality, which conforms to the conclusions made in the qualitative assessment of locality.
2.3 Possible methods and considerations for parallel implementation of the algorithm
2.4 Scalability of the algorithm and its implementations
2.4.1 Scalability of the algorithm
2.4.2 Scalability of the algorithm implementation
Let us study scalability for the parallel implementation of Dijkstra's algorithm in accordance with Scalability methodology. This study was conducted using the Lomonosov supercomputer of the [4] Moscow University Supercomputing Center. Variable parameters for the start-up of the algorithm implementation and the limits of parameter variations:
- number of processors [4, 8 : 128] with the squares of integers;
- graph size [16000:64000] with the step 16000.
The following figure shows the graph of the performance of the chosen implementation as a function of the variable start-up parameters.
In view of the features of this parallel implementation of Dijkstra's algorithm, the overall performance is rather low. With the growth in the number of processors, the performance improves slowly and even decreases when this number approaches 128. This is explained by the use of collective operations at each iteration of the algorithm and the fact that the communication expenses grow significantly with the increasing number of processors. On each processor, computations are performed fairly fast; consequently, the decomposition of the graph hardly compensates the communication expenses.
The parallel implementation in C language under discussion
2.5 Dynamic characteristics and efficiency of the algorithm implementation
The experiments were conducted for the above implementation of Dijkstra's algorithm. All the results were obtained with the «Lomonosov» supercomputer. We used Intel Xeon X5570 processors with the peak performance 94 Gflops and the Intel 13.1.0 compiler. The figures illustrate the efficiency of this implementation for 32 processors.
The graph of CPU loading shows that the loading is about 50 percent almost all the time. This indicates that the processors are loaded uniformly when 8 processes per computational node are executed and Hyper Threading is not used.
Figure 10 shows the graph of the number of floating-point operations per second. It is seen that the overall performance is very low; namely, the peak performance is approximately 250 Kflops, and the performance averaged over all the nodes is about 150 Kflops. This indicates that almost all the calculations in the program are performed on integers.
The graph of L1 cache misses shows that, for several cores, the number of misses is very large. This number is on the level 15 millions per second (the peak values are up to 60 mln/sec), which indicates intensive calculations within some of processes. The number of misses averaged over all the nodes is considerably lower (about 9 mln/sec). This shows that calculations are distributed non-uniformly.
The graph of L3 cache misses shows that this number is very low (about 1,2 mln/sec); however, the value averaged over all the nodes is approximately 0,5 mln/sec. The ratio L1|L3 of cache misses for processes with high performance can be as large as 60, but its average value is about 30. This indicates a very good locality of calculations both of some processes and (on the average) of all the processes, which is an evidence of high performance.
The picture shown in the graph of memory accesses is fairly typical for such applications. The activity of reading is rather low; in combination with low values of L3 cache misses, this indicates good locality. The good locality also indicates that, for this problem, the value about 1 mln/sec is the result of high computational performance, although there is some non-uniformity between the processes.
The graph of memory writes demonstrates a similar picture of non-uniform computations: at one and the same time, only several processes actively perform writes. This correlates with other graphs. One should note a rather low number of memory writes, which indicates a good organization of computations and the sufficiently efficient memory access performance.
The graph of the data rate through Infiniband network shows a fairly high rate measured in bytes per second. This says that the processes communicate intensively and the data portions exchanged are probably rather small because the computational performance is high. It should be noted that the data rate is different for different processes, which indicates an imbalance in computations.
The graph of the data rate measured in packets per second demonstrates an extremely high intensity of data communication. This probably says that the processes very intensively exchange with not very large amounts of data. At each step, collective operations with small portions of data are used, which explains the above observations. The imbalance between the processes is less than those in the graphs of memory use, computations, and data rate in bytes per second. This indicates that the distinct processes exchange with the same number of packets; however, they obtain different amounts of data and perform non-uniform computations.
The graph of the number of processes expecting the beginning of the calculation stage (Loadavg) shows that the value of this parameter in the course of the program execution is a constant, which is approximately equal to 8. This indicates that the program performs stably and all the nodes are loaded with calculations. This also testifies to a very rational and static loading of the hardware resources, as well as a reasonable efficiency of the implementation under study. On the whole, the data of system monitoring make it possible to conclude that the program functioned rather efficiently and stably. The use of memory is very intensive, and the use of communication environment is extremely intensive, whereas the amounts of the transmitted data are not large. For the algorithmic side of the program, this indicates the insistence on the latency of communication environment. To all appearance, the low efficiency is caused by a fairly high amount of transmission from each process and intensive exchanges by messages.
2.6 Conclusions for different classes of computer architecture
2.7 Existing implementations of the algorithm
- C++: Boost Graph Library (functions
dijkstra_shortest_paths,dijkstra_shortest_paths_no_color_map), complexity [math]O(m + n \ln n)[/math]. - C++, MPI: Parallel Boost Graph Library:
- function
eager_dijkstra_shortest_paths– direct implementation of Dijkstra's algorithm; - function
crauser_et_al_shortest_paths– implementation of Dijkstra's algorithm as proposed in the paper [5]
- function
- Python: NetworkX (function
single_source_dijkstra). - Python/C++: NetworKit (class
networkit.graph.Dijkstra).
3 References
- ↑ Dijkstra, E W. “A Note on Two Problems in Connexion with Graphs.” Numerische Mathematik 1, no. 1 (December 1959): 269–71. doi:10.1007/BF01386390.
- ↑ Jump up to: 2.0 2.1 2.2 Fredman, Michael L, and Robert Endre Tarjan. “Fibonacci Heaps and Their Uses in Improved Network Optimization Algorithms.” Journal of the ACM 34, no. 3 (July 1987): 596–615. doi:10.1145/28869.28874.
- ↑ Crauser, A, K Mehlhorn, U Meyer, and P Sanders. “A Parallelization of Dijkstra's Shortest Path Algorithm,” Proceedings of Mathematical Foundations of Computer Science / Lecture Notes in Computer Science, 1450:722–31, Berlin, Heidelberg: Springer, 1998. doi:10.1007/BFb0055823.
- ↑ Воеводин Вл., Жуматий С., Соболев С., Антонов А., Брызгалов П., Никитенко Д., Стефанов К., Воеводин Вад. Практика суперкомпьютера «Ломоносов» // Открытые системы, 2012, N 7, С. 36-39.
- ↑ Crauser, A, K Mehlhorn, U Meyer, and P Sanders. “A Parallelization of Dijkstra's Shortest Path Algorithm,” Proceedings of Mathematical Foundations of Computer Science / Lecture Notes in Computer Science, 1450:722–31, Berlin, Heidelberg: Springer, 1998. doi:10.1007/BFb0055823.
